Building Dashboard Scorecards That Keep Teams Accountable
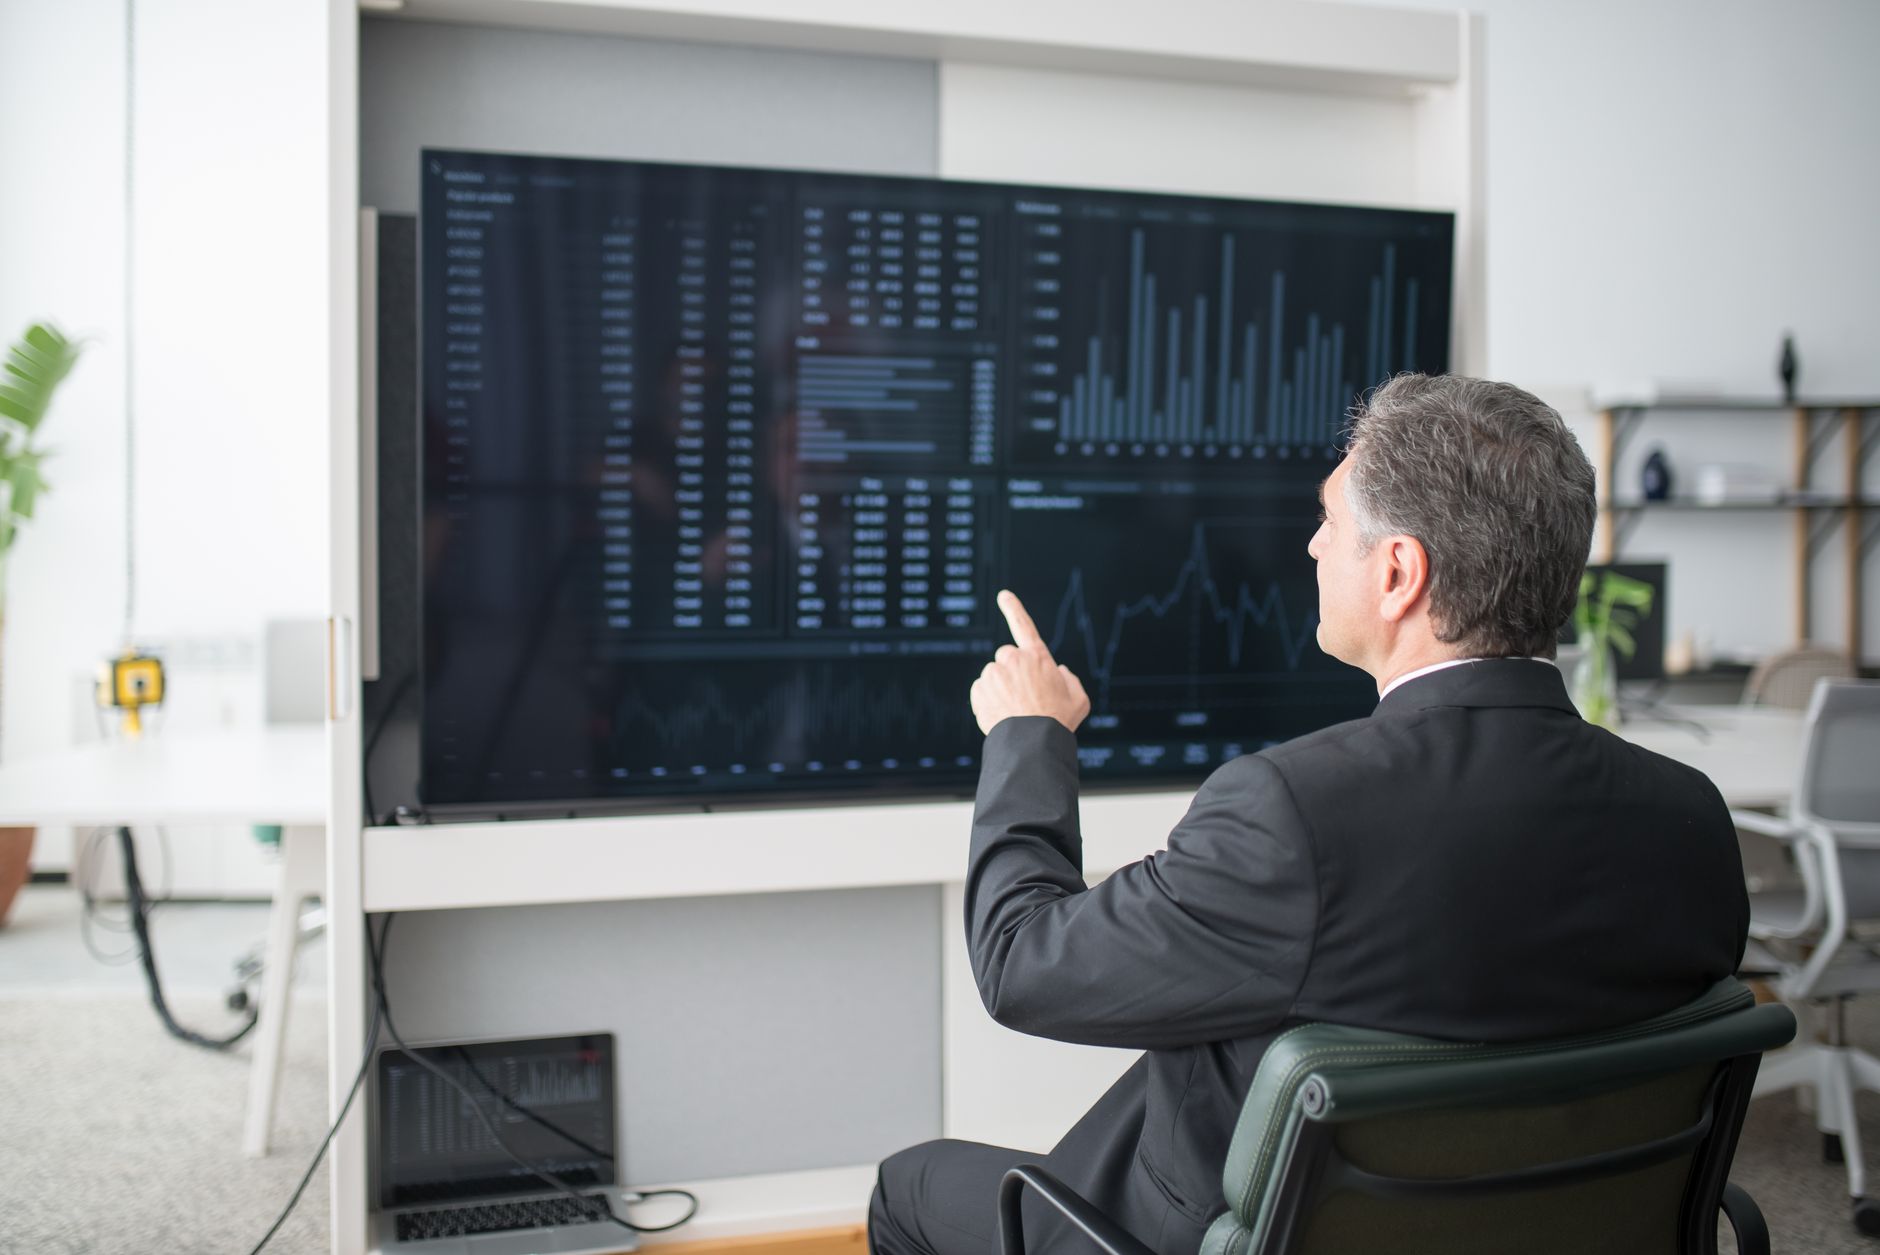
Tracking lagging financial indicators like monthly revenue is like driving a high-speed vehicle purely by looking in the rearview mirror. It shows where you've been, but tells you nothing about immediate obstacles ahead.
High-performance operations rely heavily on leading indicators—measurable, daily operational variables that directly dictate future results. Our coaching helps leadership teams design highly actionable dashboards that highlight performance drift before it impacts bottom-line performance.
Designing the Perfect Metric Cascade
We work with team leaders to construct highly integrated KPI tracking models. If a frontline indicator drops below pre-defined targets, the dashboard alerts operators to correct course, allowing executive leadership to step back from micro-management.
This systemic model transforms management from stressful, reactive firefighting into calm, data-backed operational engineering.
Build Your Team's Performance Dashboard
Work directly with our consultants to implement actionable KPI rhythms across your organization.